Solar in Liverpool
Solar panels in Liverpool: how many, and how much they make
Before thinking about grants, it helps to know the basics: how common solar already is in Liverpool, how much a roof here can produce, and how the city's housing shapes what's possible. These figures come from DESNZ, the European Commission's PVGIS tool and the 2021 Census.
Where you stand
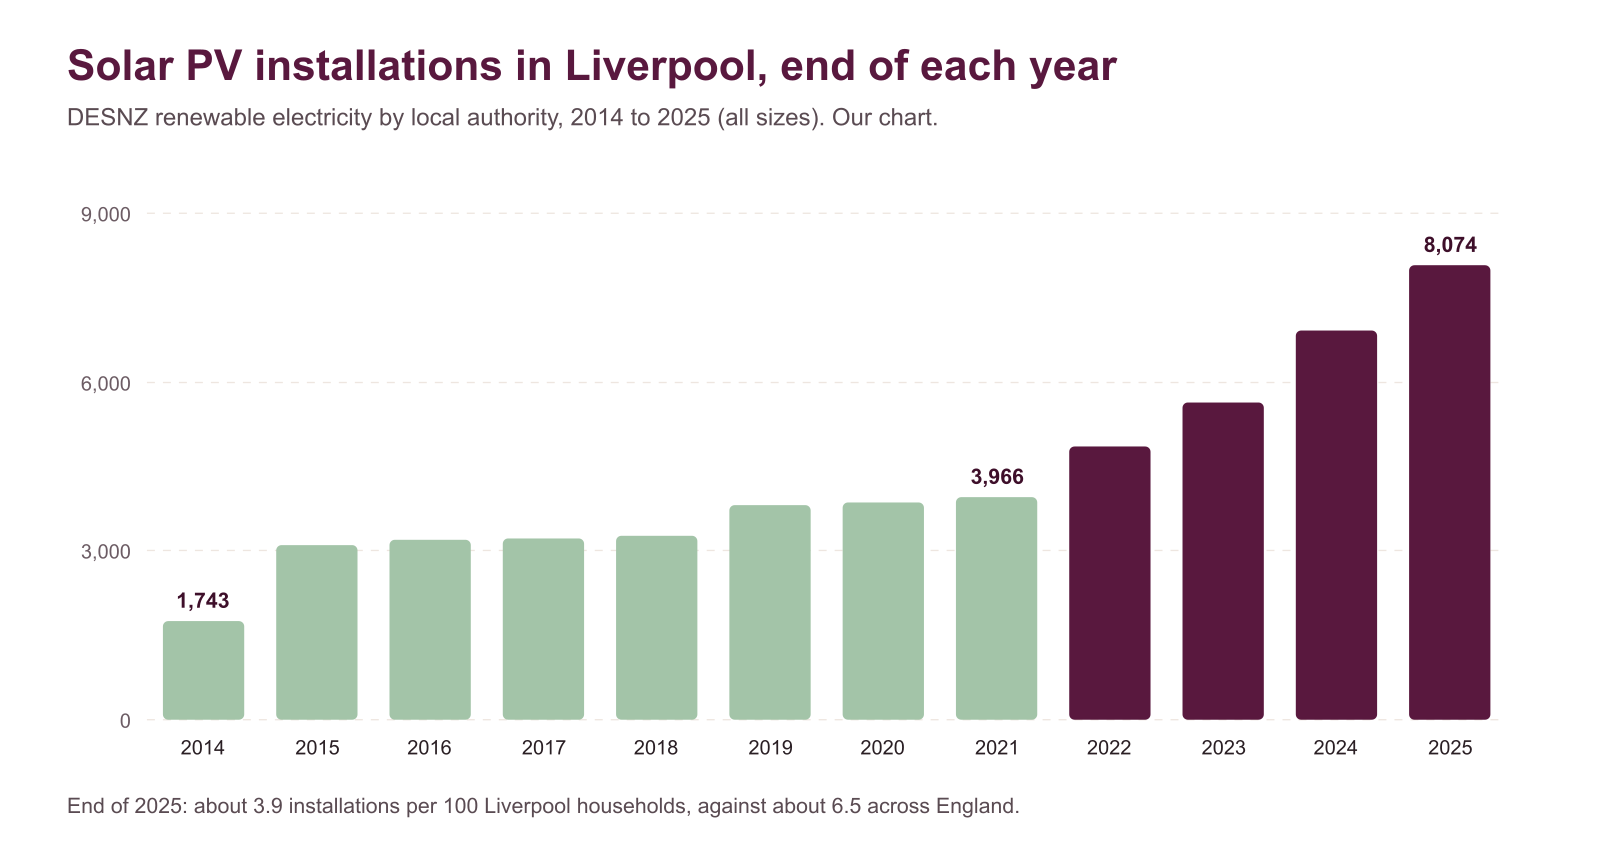
DESNZ counted 8,074 solar PV installations in Liverpool at the end of 2025, about 3.9 per 100 households against about 6.5 across England. A south-facing kWp here produces roughly 964 kWh a year.
Take-up
A slow decade, then a sharp rise
DESNZ publishes counts of renewable electricity installations by local authority each year. For Liverpool, solar PV installations stood at 1,743 at the end of 2014 and nearly doubled the next year. They then barely moved for six years: 3,966 by the end of 2021.
Since then the count has climbed every year, to 8,074 at the end of 2025, with installed capacity of about 32.94 MW. The statistics count installations; they don't record why people chose to install.
The series
Installations at the end of each year
| End of | Installations |
|---|---|
| 2014 | 1,743 |
| 2015 | 3,095 |
| 2017 | 3,225 |
| 2019 | 3,805 |
| 2021 | 3,966 |
| 2022 | 4,859 |
| 2023 | 5,632 |
| 2024 | 6,916 |
| 2025 | 8,074 |
Against England
Still behind the national rate
Dividing the 2025 count by DESNZ's household estimate for Liverpool gives about 3.9 installations per 100 households. Across England's local authorities the same sum gives about 6.5. Liverpool's rate is a little over half the national one.
Two cautions. The counts include installations of every size, from a terraced roof to a warehouse, so they aren't the same as "homes with panels". And DESNZ notes that many installations made in 2025 couldn't yet be matched to a local authority when the figures were produced, so the latest year is likely to be revised upwards, in Liverpool and elsewhere.
The gap matters for grant-seekers only indirectly: it means solar is still unusual on many Liverpool streets, and that neighbours and landlords may have little experience of it.
Output
What a Liverpool roof can produce
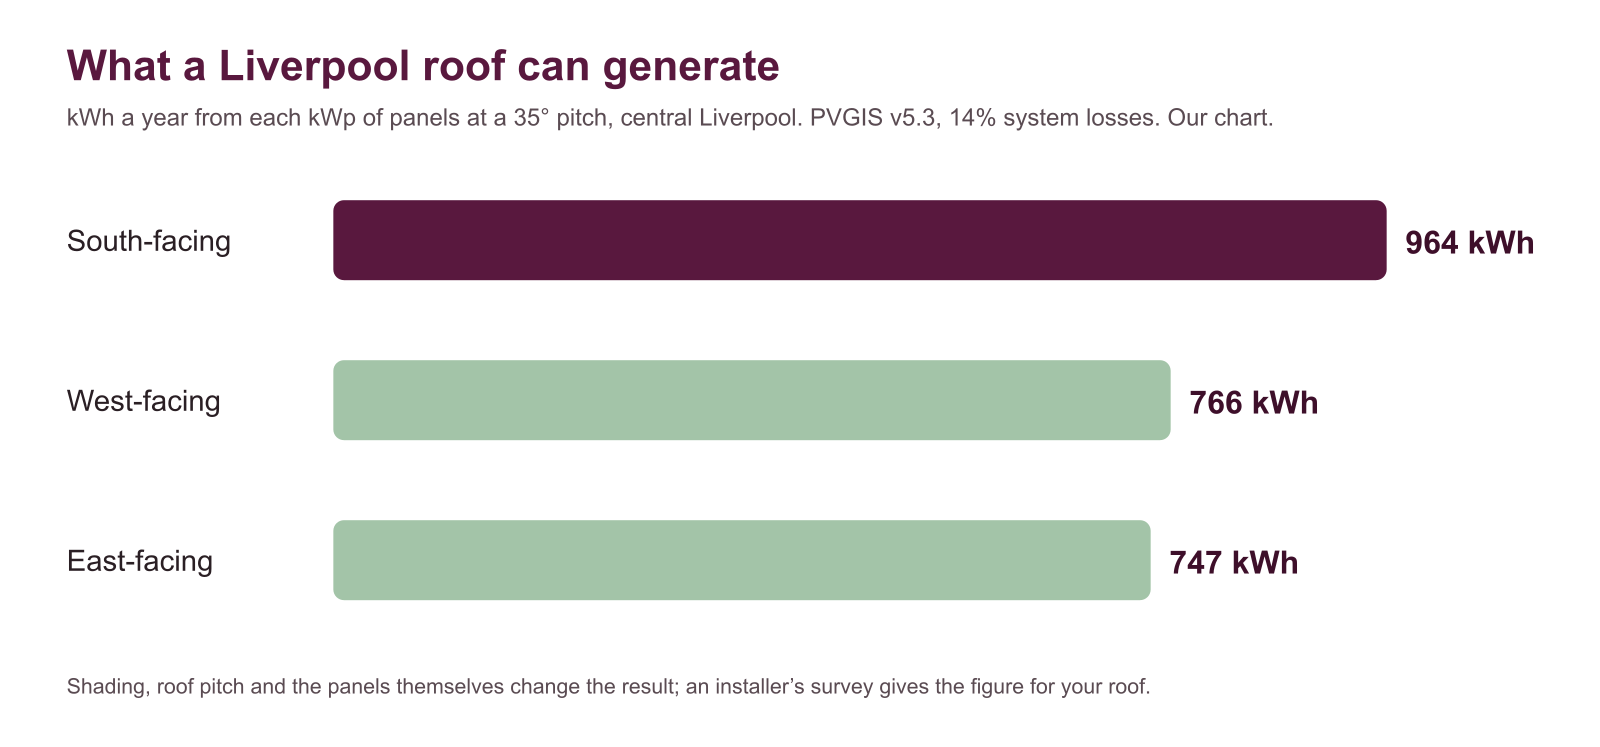
The European Commission's PVGIS tool estimates solar output from satellite data. For central Liverpool, using its SARAH3 data for 2005 to 2023, a 35° pitch and 14% system losses, each kilowatt-peak of panels produces about:
- 964 kWh a year facing south;
- 766 kWh facing west;
- 747 kWh facing east.
Most of that comes between spring and early autumn. A typical home system is a few kilowatt-peak, so multiply accordingly, then allow for shading and the exact roof. An installer's survey should give a figure for your roof, with its working shown.
The housing
Terraces, flats and rented homes
Census 2021 shows 37.9% of Liverpool households in terraced houses, against 23.0% across England, and 17.2% in purpose-built flats. Detached houses, the easiest roofs for solar, make up only 8.2%, against 22.9% nationally.
A terraced roof is smaller and may be shaded by chimneys or the next row, but it can still take a worthwhile array. Flats are harder: the roof is usually shared, and the freeholder decides. New permitted development rules in England from August 2026 have widened what can be done on flats, though consent from the building's owner is still needed. See planning.
Who owns the roof
Ownership decides who can say yes
Only 46.8% of Liverpool households own their home, against 61.3% across England. For everyone else, panels depend on a landlord or a freeholder. That's one reason Warm Homes: Local Grant's rules for rented homes matter so much here. See renters and landlords.
Conservation areas add another layer: Liverpool City Council says its 36 conservation areas cover 9% of the city and about 19,000 properties, where panels on a front roof may need permission.
Paying
From figures to a decision
Output figures are the starting point for any decision about cost. If a grant isn't available, the main levers are the VAT zero rate on installation until 31 March 2027, a Warm Homes loan for homeowners, and export payments for surplus electricity. See paying yourself.
Checking claims
Test any yield a seller quotes
If a salesperson quotes a yield far above the PVGIS figures for the size of system and the direction of your roof, ask how it was calculated. A figure based on an ideal south-facing roof won't hold for an east-west terrace. Ask for the estimate in writing and keep it with the quote.
Liverpool solar questions
How many homes in Liverpool have solar panels?
DESNZ counted 8,074 solar PV installations in Liverpool at the end of 2025. That figure covers installations of all sizes, not only homes, and DESNZ notes that some installations made in 2025 couldn’t yet be assigned to a local authority.
Is Liverpool sunny enough for solar?
PVGIS estimates about 964 kWh a year for each kWp of south-facing panels at a 35° pitch in central Liverpool. Panels work in daylight, not just direct sun, though output is much lower in winter.
Does an east- or west-facing roof work?
Yes, with less output: PVGIS puts it at about 766 kWh facing west and 747 kWh facing east per kWp, roughly a fifth less than south.
Why is take-up lower than in England as a whole?
The figures don’t say why. Lower home ownership, more flats and terraced roofs, and conservation areas are all plausible parts of the picture, but we haven’t seen a study that measures them.
Sources for this page
- DESNZ › Regional renewable statistics (renewable electricity by local authority, 2014 to 2025), read 3 November 2026
- European Commission JRC › PVGIS photovoltaic tool (v5.3, SARAH3), read 3 November 2026
- Nomis › Census 2021 TS044, accommodation type, read 3 November 2026
- Nomis › Census 2021 TS054, tenure, read 3 November 2026
- Liverpool City Council › Conservation areas, read 3 November 2026
- legislation.gov.uk › SI 2026/896, permitted development for solar in England, read 2 November 2026
- HMRC › VAT Notice 708/6, energy-saving materials and heating equipment, read 3 November 2026
- GOV.UK › Warm Homes loan: eligibility, read 3 November 2026
- GOV.UK › Smart Export Guarantee, read 3 November 2026
A question about solar funding in Liverpool?
Tell us what you're trying to find out. Your message reaches SEO-DONS LTD, which publishes this guide, and we answer by email. We don't run any grant scheme, decide eligibility or install panels, but we can point you to the scheme and the council that does.
What happens next
- Your message reaches SEO-DONS LTD, publisher of this guide.
- We answer by email, pointing to the scheme or council that applies.
- Any application is made to the council or scheme itself.